
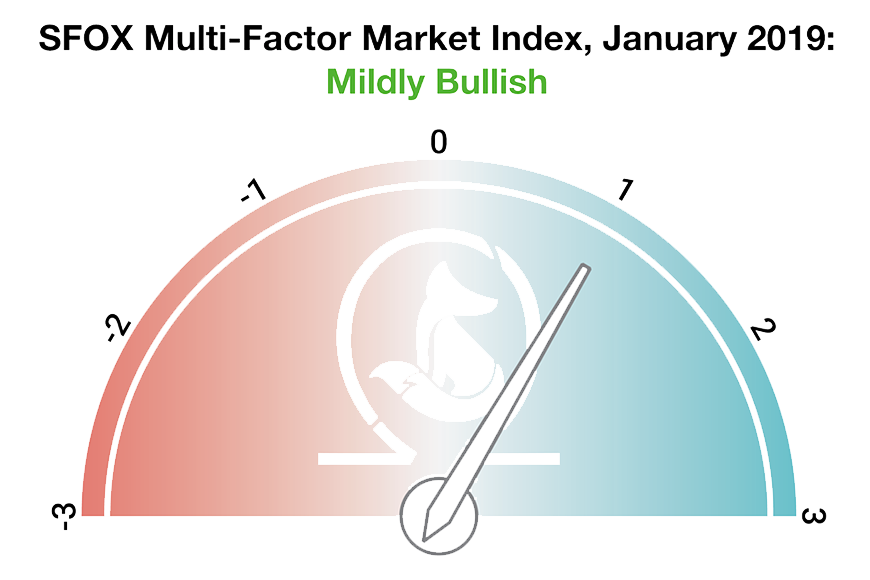
The Current State of Crypto: Crypto Outlook and Correlations in January 2019
We determine the monthly value of this index by using proprietary, quantifiable indicators to analyze three market factors: volatility, market sentiment, and continued advancement of the sector. The index ranges from highly bearish to highly bullish.
Volatility in leading crypto assets decreased throughout the month of January following the late-2018 run-up in volatility. In terms of market sentiment, we’re seeing a combination of less public attention on crypto “hype” — e.g., headlines, a 24-hour crypto news cycle, and ICOs — and sustained institutional interest in crypto exposure. We’re also seeing a compelling combination of (1) teams and institutions working on blockchain use cases and (2) increased usage of blockchain networks themselves.
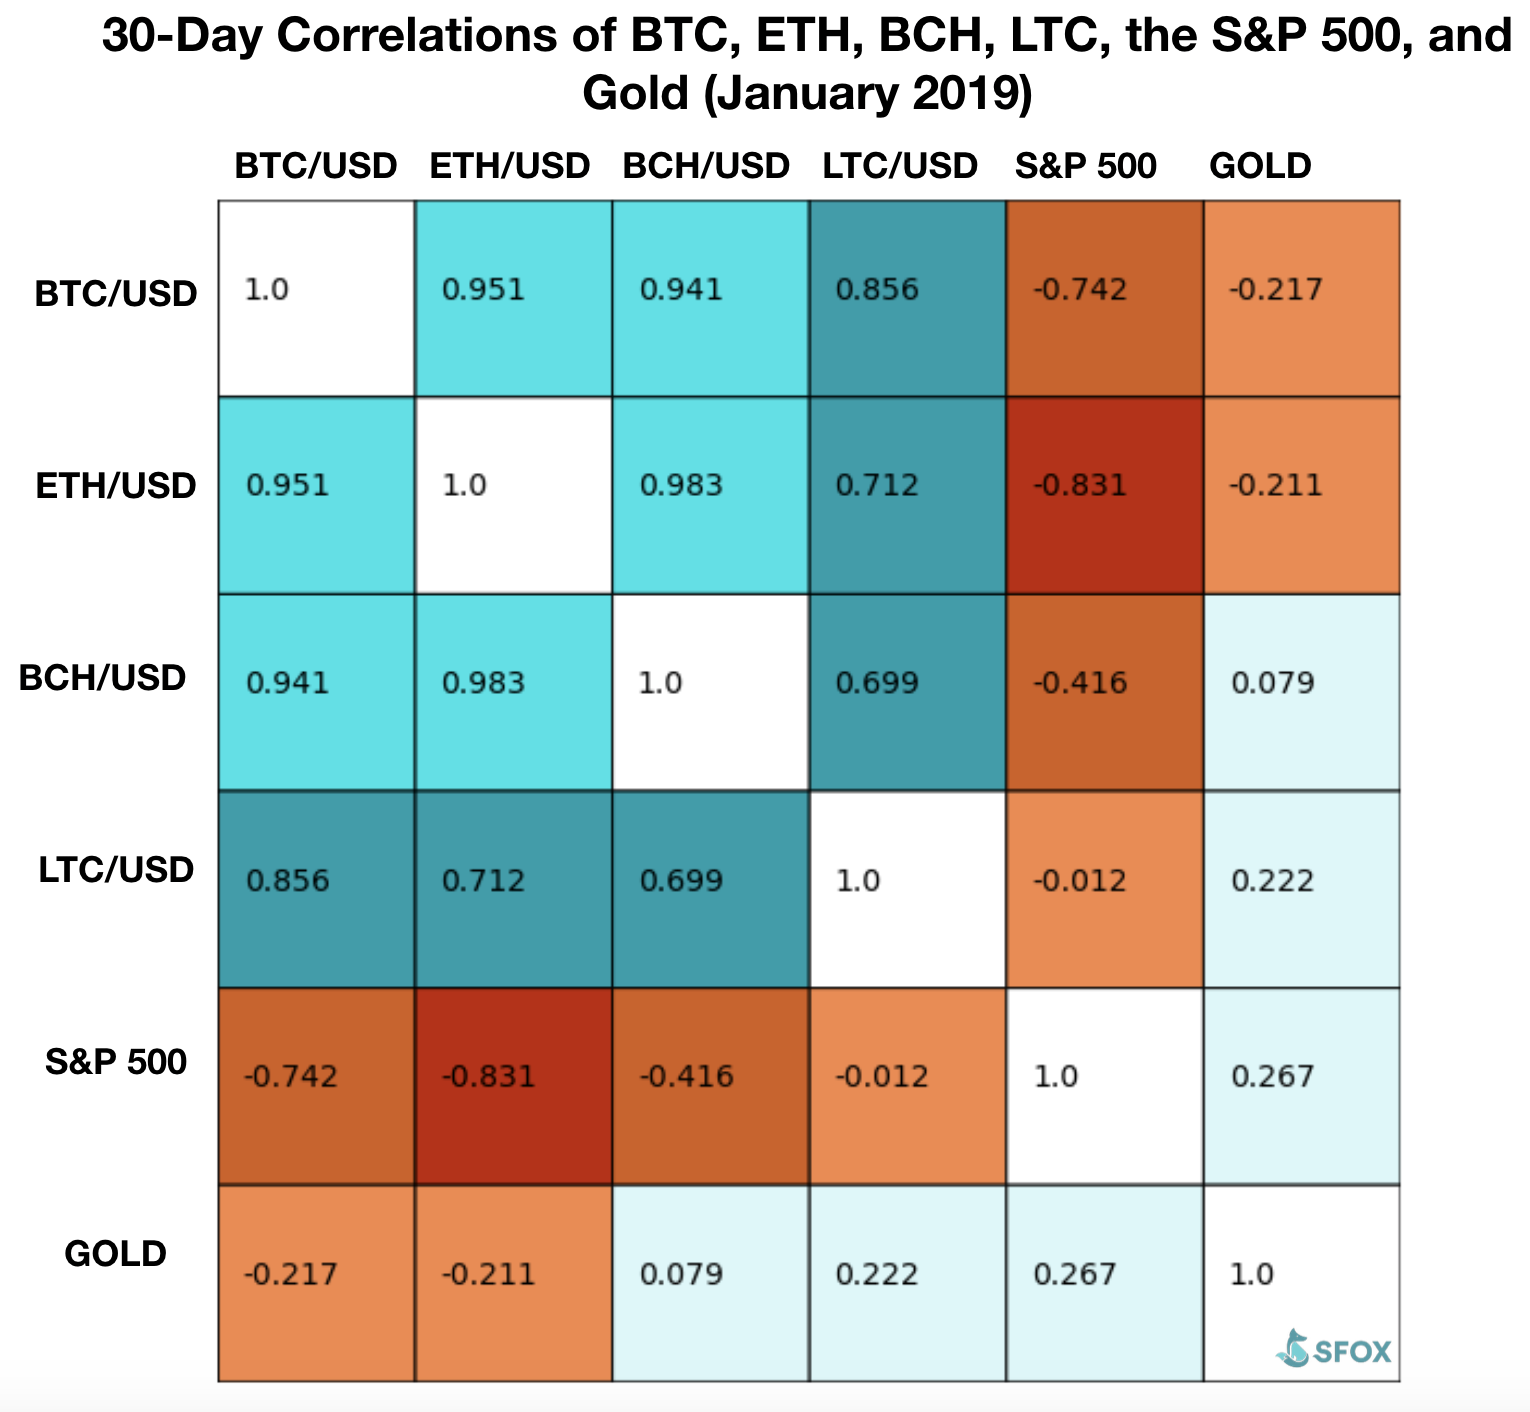
BTC’s 30-day price correlations to ETH, BCH, and LTC closed the month as very positive (i.e. close to a value of 1), though BTC was less correlated to LTC than it was to ETH and BCH. Of the cryptoassets on SFOX, LTC and BCH were the least correlated, ending the month with a 30-day correlation value of 0.699 (still fairly positive). ETH and the S&P 500 were the most negatively correlated assets at -0.831, and the asset pair showing the least correlation (i.e. close to a value of 0) is BCH and gold at 0.079.
For a full crypto correlations matrix, see the following chart:

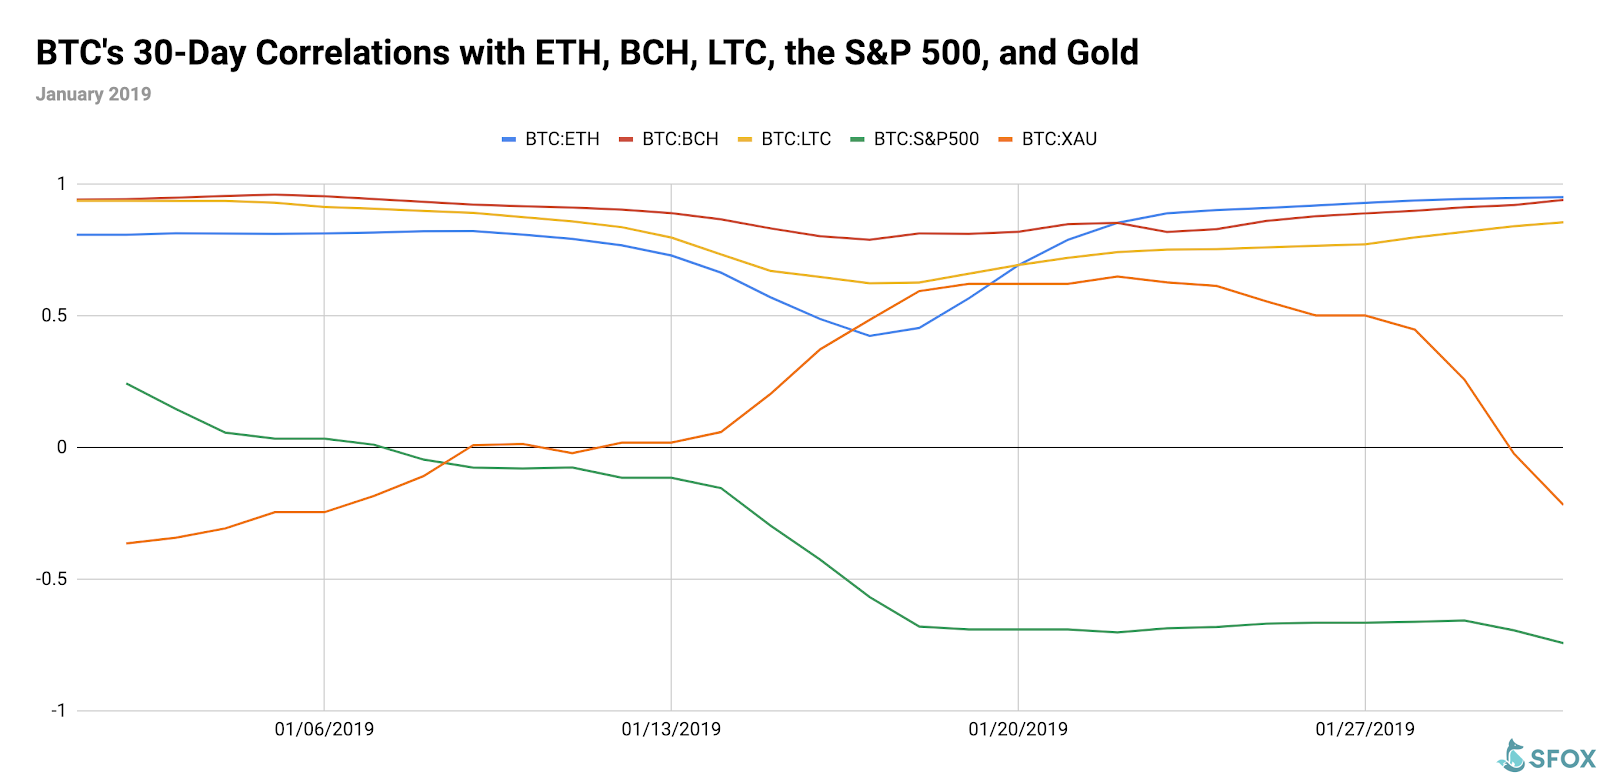
A graph of those 30-day correlations over the past month shows that there has been a significant amount of fluctuation in BTC’s correlations to the S&P 500 and gold over the last month. On the other hand, BTC’s correlations to ETH, BCH, and LTC were fairly stable throughout the month, with the exception of a dip in correlation values on the 17th.

January Overview: A Settling Wave
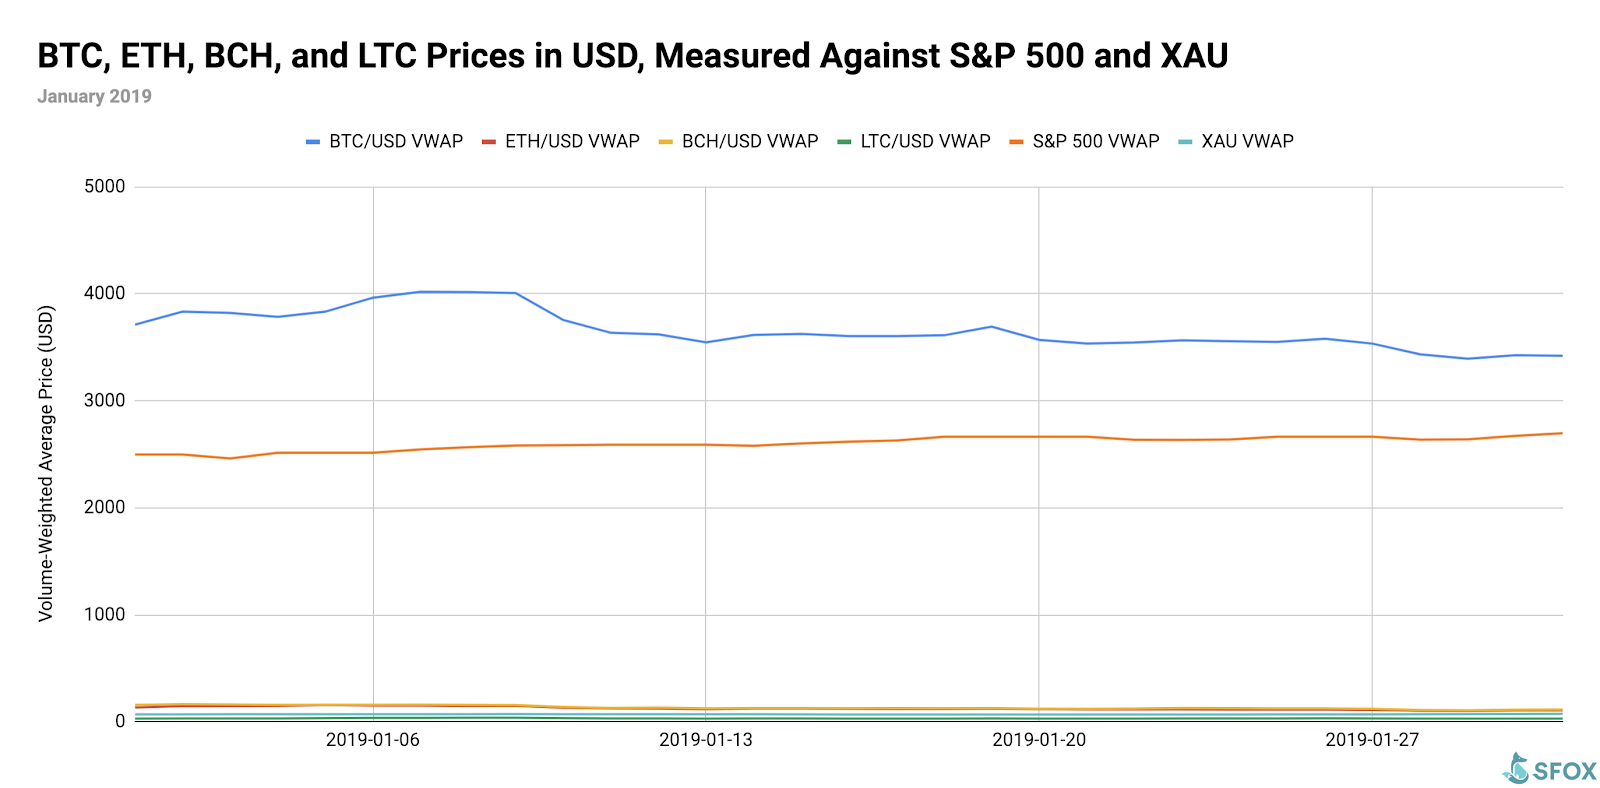
After an uptick in marketwide crypto volatility at the end of last year, January saw prices stabilize somewhat — BTC, for instance, ranged between $3,500 and $3,700 for over half the month.
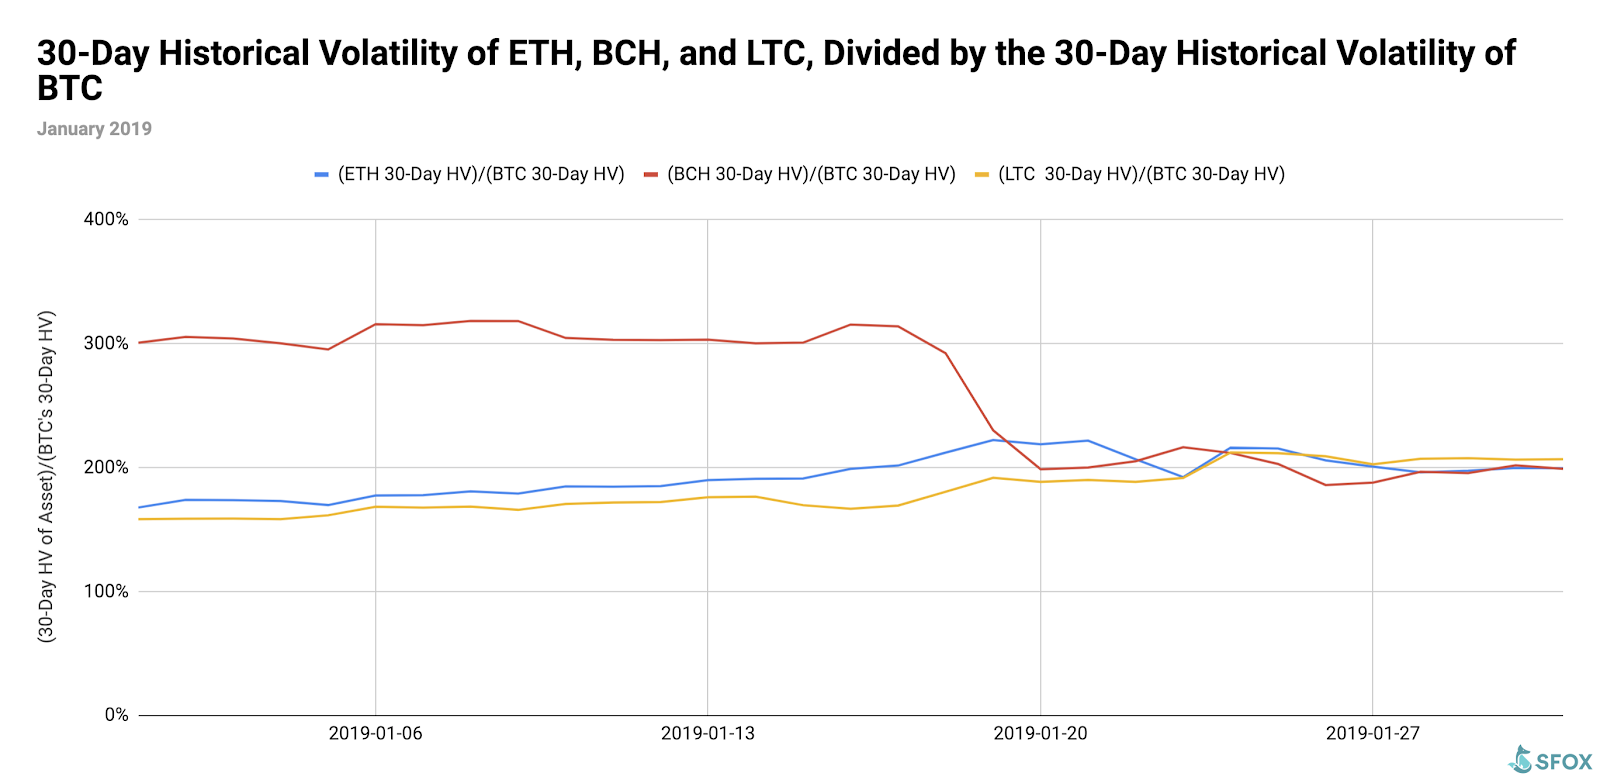
For greater graphical clarity, see this additional chart omitting BTC and the S&P 500 from the data set:

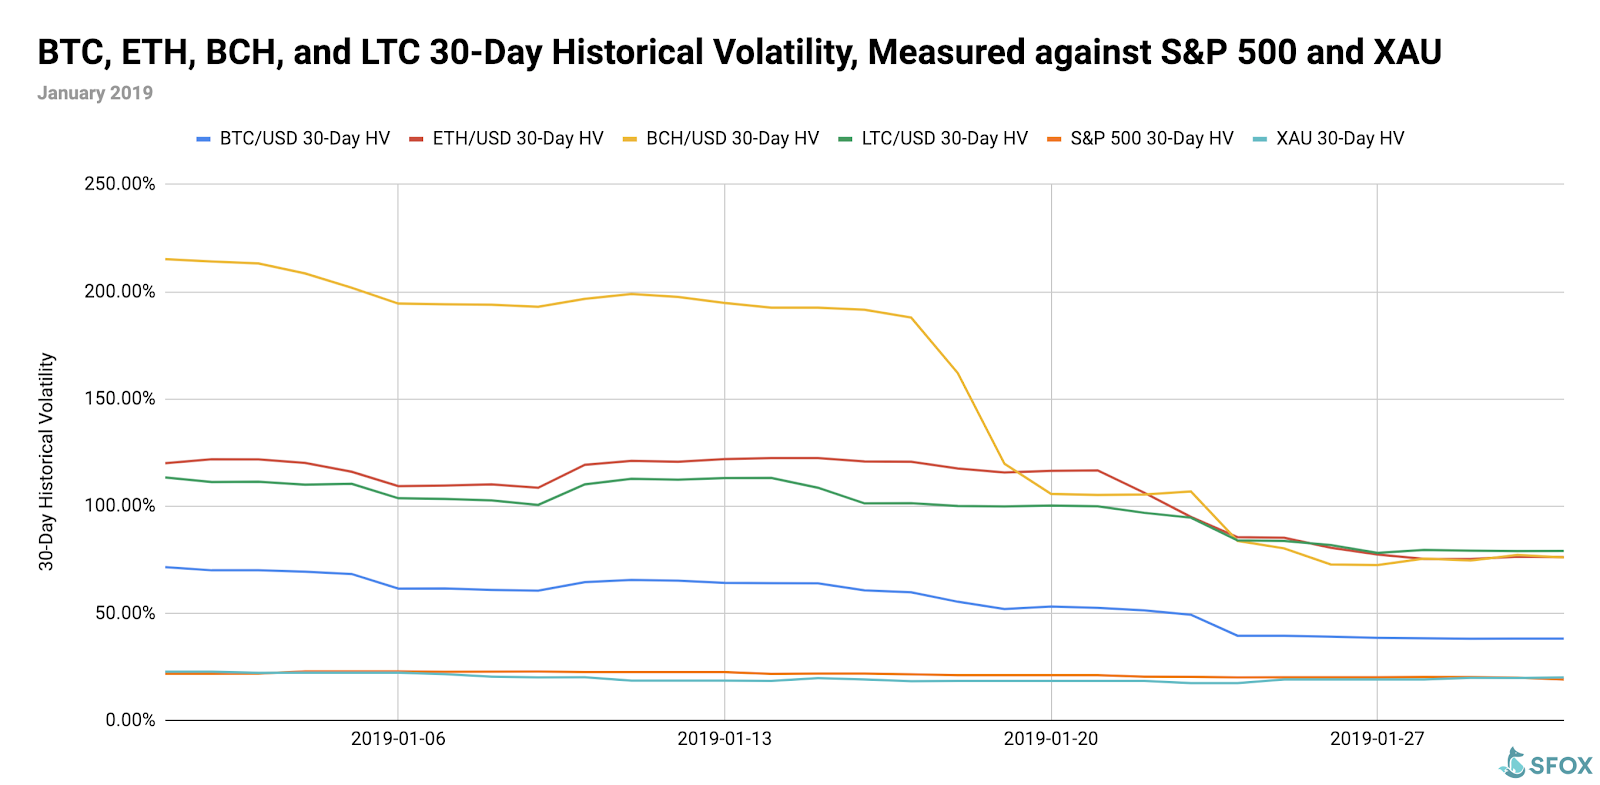
We can see the stabilizing of crypto prices in action by looking at the 30-day historical volatilities of BTC, ETH, BCH, and LTC, all of which decreased from the start of the new year to the end of January:

If we look at the 30-day historical volatilities of ETH, BCH, and LTC as a percentage of BTC’s 30-day historical volatility, we see that ETH and LTC’s movements were in line with BTC’s — that’s what the fairly horizontal slope of those lines tell us. BCH, in contrast, experienced a sharp drop in its BTC-volatility-relative volatility from the 18th to the 20th — from 300% to 200%, bringing it in line with the BTC-volatility-relative volatilities of ETH and LTC.

Analysis of January 2019 Crypto Volatility
Two things stand out in this month’s data on crypto volatility: (1) the sharp decrease in BCH’s volatility and (2) the general marketwide decrease in crypto volatility.
BCH’s decrease in volatility may signal that the conflict between BCH and BSV is subsiding. As we discussed in our year-end 2018 volatility report, BCH’s volatility initially spiked in November in anticipation of the November hard fork that created BSV — and that volatility only continued during the hash war that followed the fork. More recently, however, the BCH and BSV camps appear to have carved out a reasonably peaceful coexistence, focusing more on continuing to develop their own projects rather than attacking each other. From lessened uncertainty and lessened speculation — on both sides of the aisle — comes decreased volatility.
The overall decrease in crypto volatility may reflect the industry’s current “building phase.” With less hype and fewer major headlines in the past month, the focus has instead been on strong, dedicated teams building actually useful products and services. This redirection of attention to product development rather than avid market-watching could ultimately prove to not just correspond to lower volatility, but also make the crypto ecosystem generally healthier.
What to Watch in February 2019
Look to these events as potentially moving the volatility indices of BTC, ETH, BCH, and LTC in the coming month:
- Watch CBOE BTC futures expiration on February 13th, and CME Bitcoin futures last-trade date on February 22nd. Crypto volatility typically moves around the time of futures expirations.
- Watch the Ethereum Constantinople hard fork, expected on February 27th. The hard fork focuses on upgrades designed to ease Ethereum’s transition from proof of work to proof of stake. While it’s not expected that two separate blockchains will continue from this, as was the case with the Bitcoin Cash hard fork last November, forking networks breed some degree of uncertainty — which stokes volatility.
Use the SFOX edge in volatile times through our proprietary algorithms directly from your SFOX account.
Appendix: Data Sources, Definitions, and Methodology
We use two different in-house volatility indices in creating these reports:
- 30-day historical volatility (HV) indices are calculated from daily snapshots over the relevant 30-day period using the formula:
30-Day HV Index = σ(Ln(P1/P0), Ln(P2/P1), …, Ln(P30/P29)) * √(365)
- Daily historical volatility (HV) indices are calculated from 1440 snapshots over the relevant 24-hour period using the formula:
Daily HV Index = σ(Ln(P1/P0), Ln(P2/P1), …, Ln(P1440/P1439))* √(1440)
S&P 500 and XAU data are collected from Yahoo! Finance.
The SFOX Multi-Factor Market Index is calculated using a proprietary formula that combines quantified data on search traffic, blockchain transactions, and crypto volatility.
The cryptoasset data sources aggregated for the volatility indices presented and analyzed in this report are the following eight exchanges, the order-book data of which we collect and store in real time:
- bitFlyer
- Binance
- Bitstamp
- Bittrex
- Coinbase
- Gemini
- itBit
- Kraken
Our indices’ integration of data from multiple top liquidity providers provides a more holistic view of the crypto market’s minute-to-minute movement. There are two problems with looking to any single liquidity provider for marketwide data:
- Different liquidity providers experience widely varying trade volumes. For example, according to CoinMarketCap, Binance saw over $20 billion USD in trading volume over the last month, whereas Bitstamp saw $2 billion USD in trading volume — an order-of-magnitude difference. Therefore, treating any single liquidity provider’s data as representative of the overall market is myopic.
- Liquidity providers routinely experience interruptions in data collection. For instance, virtually every exchange undergoes regularly scheduled maintenance at one point or another, at which point their order books are unavailable and they therefore have no market data to collect or report. At best, this can prevent analysts from getting a full picture of market performance; at worst, it can make it virtually impossible to build metrics such as historical volatility indices.
Building volatility indices that collect real-time data from many distinct liquidity providers mitigates both of these problems: collecting and averaging data from different sources prevents any single source from having an outsized impact on our view of the market, and it also allows us to still have data for analysis even if one or two of those sources experience interruptions. We use five redundant data collection mechanisms for each exchange in order to ensure that our data collection will remain uninterrupted even in the event of multiple failures.
Readers should note that we have also enabled the trading of Bitcoin SV and Ethereum Classic on SFOX. We are still in the process of collecting sufficient data on these cryptoassets to analyze them in accordance with our above standards. Presently, we anticipate that data on ETC will be in the volatility report starting next month (the February 2019 edition), and data on BSV will be added to the report in the following month (the March 2019 edition).
SFOX is a premier broker-dealer for sophisticated cryptocurrency investors. Their platform is specifically optimized to meet the rigorous standards of high-volume and institutional investors and give them a competitive edge when trading. The SFOX Research team provides in-depth analysis of the crypto market, including a monthly volatility report which analyzes market data and sentiment.