

![]()

Published by the team of Alethio, an Ethereum data analytics platform & creator of DEXWatch, a real-time market and trading activity information explorer across Ethereum’s decentralized exchanges (DEXs)
Decentralized Exchanges emerged in 2018 and flourished in the past year. With Decentralized Financial upending the economics of Ethereum, DEXs now shoulder more crucial roles as liquidity providers for lending and derivatives applications.
It’s been a year and a half since our first article out in 2018. In the past year, Alethio, as the team behind DEXWatch, witnessed lots of protocol upgrades and new players entering the game. Now let’s recap by data and visuals to learn its evolution in the past year.
Dataset & Methodology
In this recap, we included 20 DEXs in the sample for the whole year of 2019:

Volume charts in this article only reflect values collected from these 20 DEXs. More protocols will be added in future pieces. Also, non-fungible tokens (NFTs, ERC-721s) are not included in this dataset.
Due to different unique attributes from DEXs’ protocol mechanisms, some of the metrics may have different meanings under different cases. We will note them when relevant.
DEX Platform Analysis
Daily Count of Transactions Across DEXs
EtherDelta and IDEX gained massive adoption in 2017 and 2018, and until 2019 remained the two largest DEXs by trade count (check our dashboard). Starting in mid-2018, more protocols and relayers emerged. By late 2018, Uniswap was booming due to its superior usability, and by the end of 2019 had achieved #2 status of daily transactions.
In the timeline below, we can see over the past year, when it comes to the number of transactions, IDEX still leads the market while Uniswap, Kyber, and Bancor have grown to outrank EtherDelta.
The number of transactions on IDEX spiked around Q2 (up to an average of ~7000 trades per day), and then went back to ~3000 trades/day in Q4. Uniswap, Kyber, and Bancor take the following 3 places interchangeably, with average daily count fluctuating around the ~1k — 2k range.
Note that a single trade order can be matched across DEXs and counted twice. Also, the number of transactions is not equal to the trading volume here, as the traded volume per transaction varies. We will discuss the trading volume later in this piece.
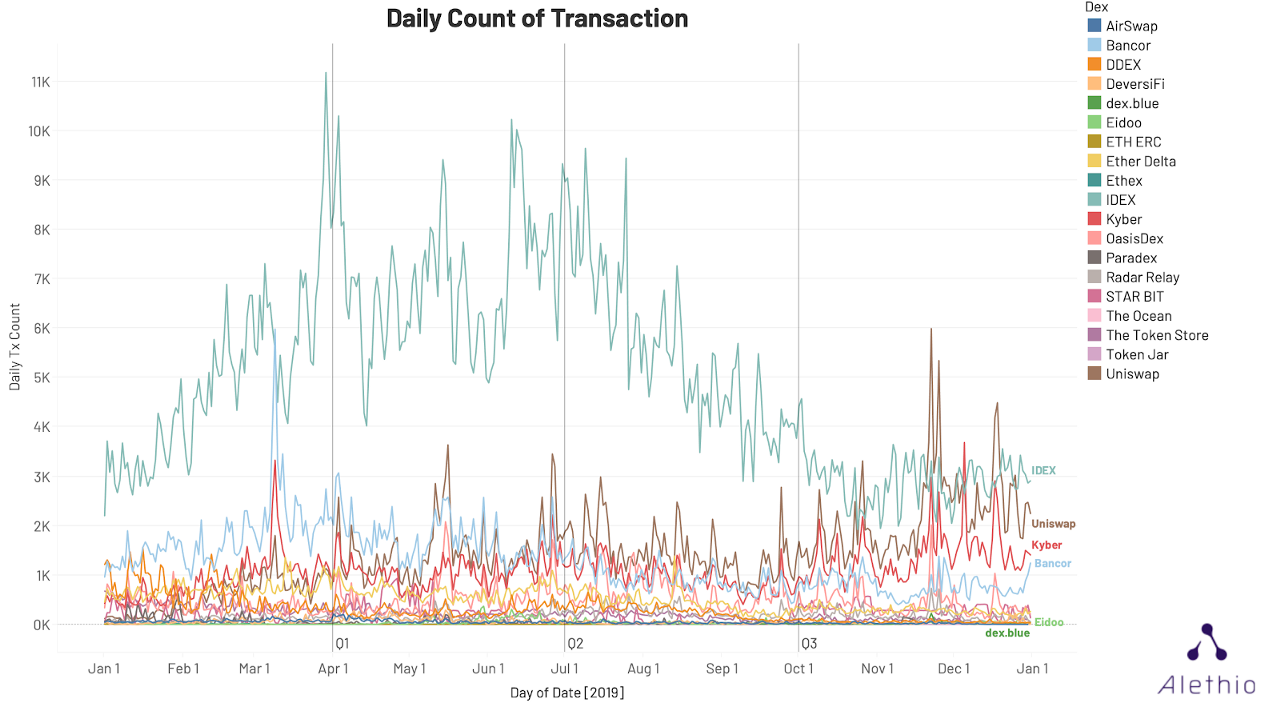

We will use the same legends for DEXs across this piece, as labeled above.
Monthly Trading Volume Against ETH Across DEXs
Most DEXs don’t provide fiat onramps, so a DEX trader will either trade a token or the native coin on Ethereum (ETH). To swap equivalent amounts of ETH, there are wrapped tokens that serve as bridges on some DEXs (e.g. WETH on 0x, ETHW on DeversiFi, ETH Token on Bancor), which represent the same value and price for ETH.
We can classify DEX trades into 2 types:
- Trades between tokenX and tokenY,
- or tokenX to ETH (ETH to tokenX).
To estimate the trading volume for all tokens, we found it is tricky to match the accurate real-time token value in USD, as the USD prices for all tokens can be hard to collect and they are also collected from centralized exchanges. We decided to measure trading volumes in ETH and to only consider trades against ETH (including wrapped tokens), because direct token-to-token trades’ converter price will be either incomplete (hard to collect all) or lagged (estimated from latest past trades). Our data, therefore, does miss volumes from direct token-to-token trades. However, for most major DEXs, protocols usually split token-to-token trades into 2 trades: tokenX to ETH, and ETH to tokenY, which is captured in our data.
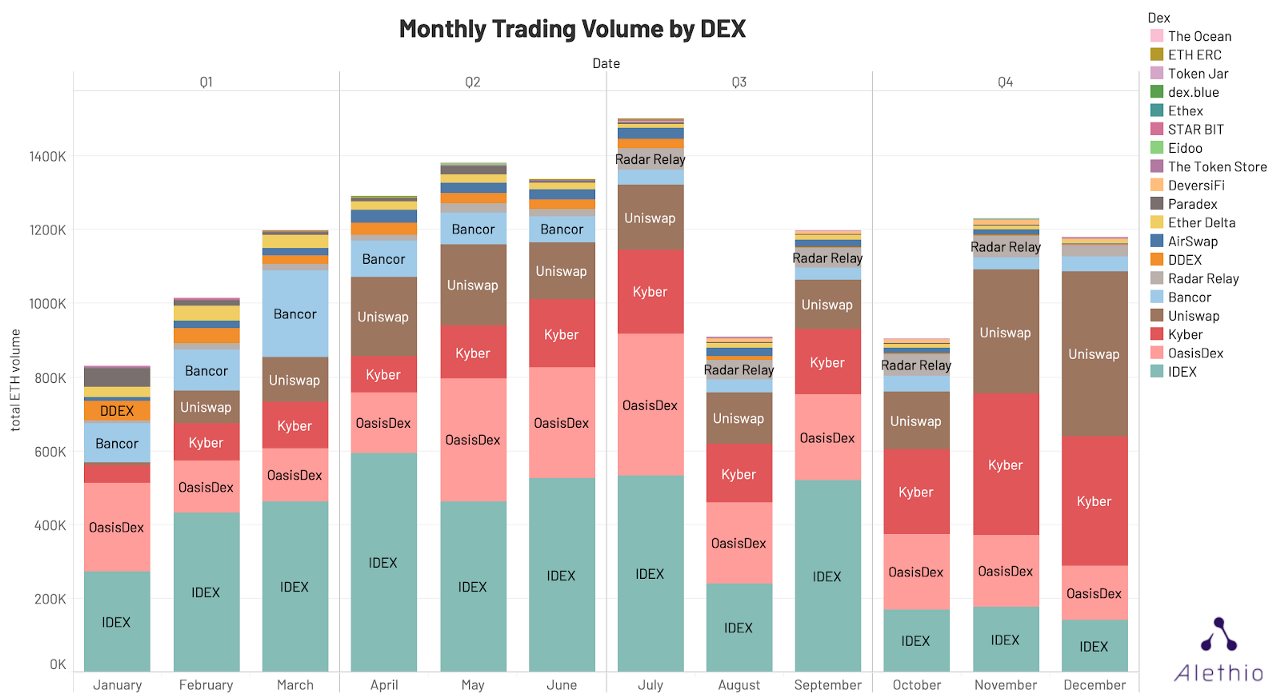

Figure 2 shows trading volumes in ETH for each DEX. We see DEXs’ total ETH volume rankings look consistent with the transaction count chart (figure 1). IDEX, ranked #1, generated a volume of ~400k ETH per month on average for the first 3 quarters, with a decreased mean value of around 200k ETH per month in Q4. OasisDex, Kyber, Bancor, and Uniswap follows.
Token Performance
Monthly Trading Volumes of Tokens Against ETH
Just within the list of 20 monitored DEXs, we see ~4.3k different tokens traded in the past year. Below shows a timeline of trading volume for tokens which were traded against ETH:
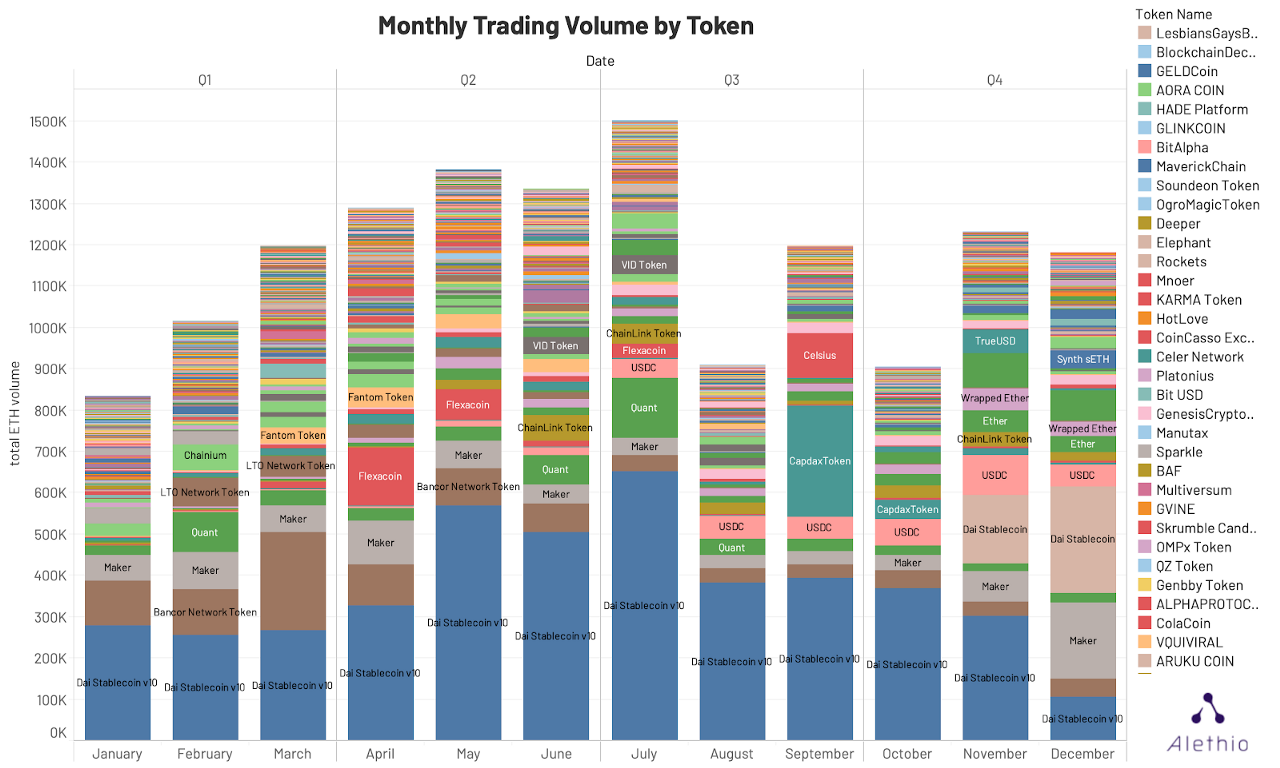

With the rise of decentralized finance, we see the Dai stablecoin v1.0 (in blue, now renamed as SAI) as the most-traded token this year. Other stablecoins including USD and TrueUSD sustained high trading volumes throughout the year. The new DAI (labeled Dai Stablecoin) emerged in Q4 of 2019, and quickly gained market share as the #2 token.
ChainLink token’s volume rocketed in June and July, which coincides with market excitement around the ChainLink project connecting dapps with the real world.
Top 10 Tokens by Trading Volumes Against ETH
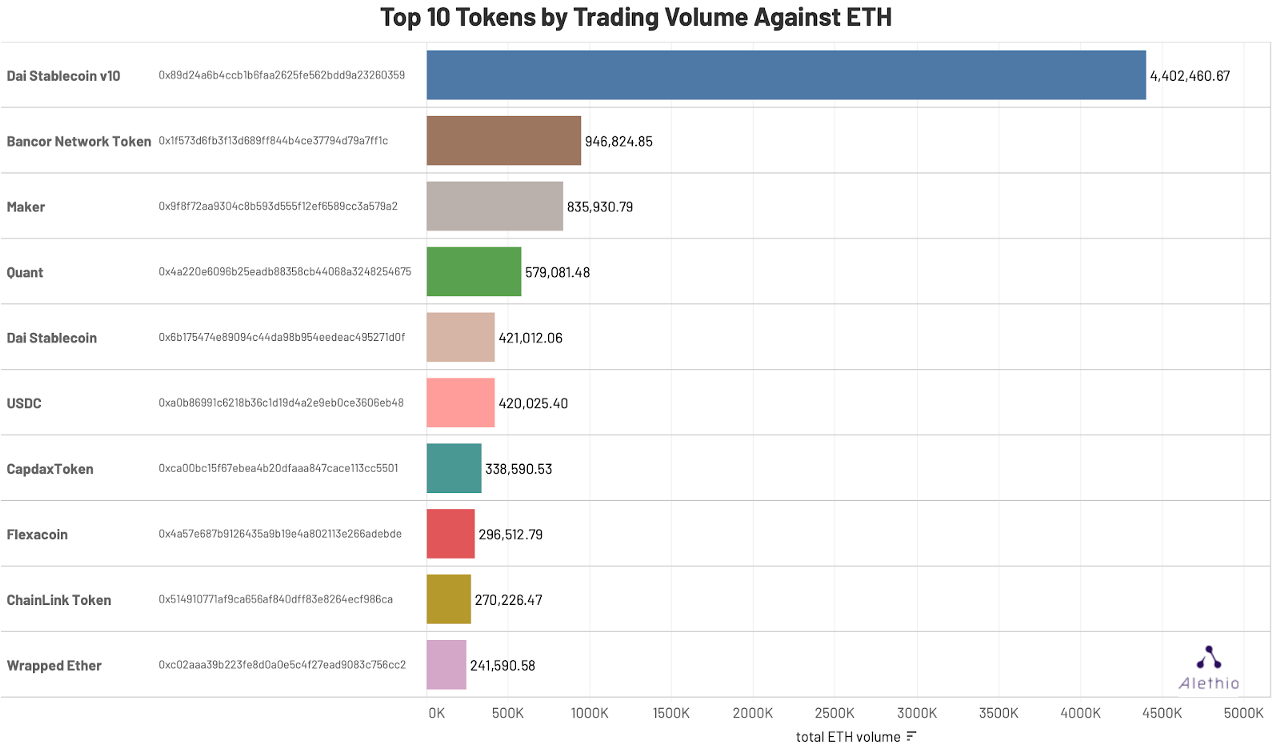

Summing up volumes across the whole year, we see SAI (labeled as Dai Stablecoin v10 in fig. 4) has been traded for over 4.4million ETH, which outnumbered BNT, at #2, by ~4.6 to 1. Figure 4 also highlights some particularly trendy projects from this past year, including MakerDAO, Quant, Capdex, Flexacoin.
Furthermore, we created the word cloud below to find out which DEX platforms provided liquidity for those top tokens. Words are colored by DEXs accordingly and size represents the particular token’s volume traded against ETH on it.
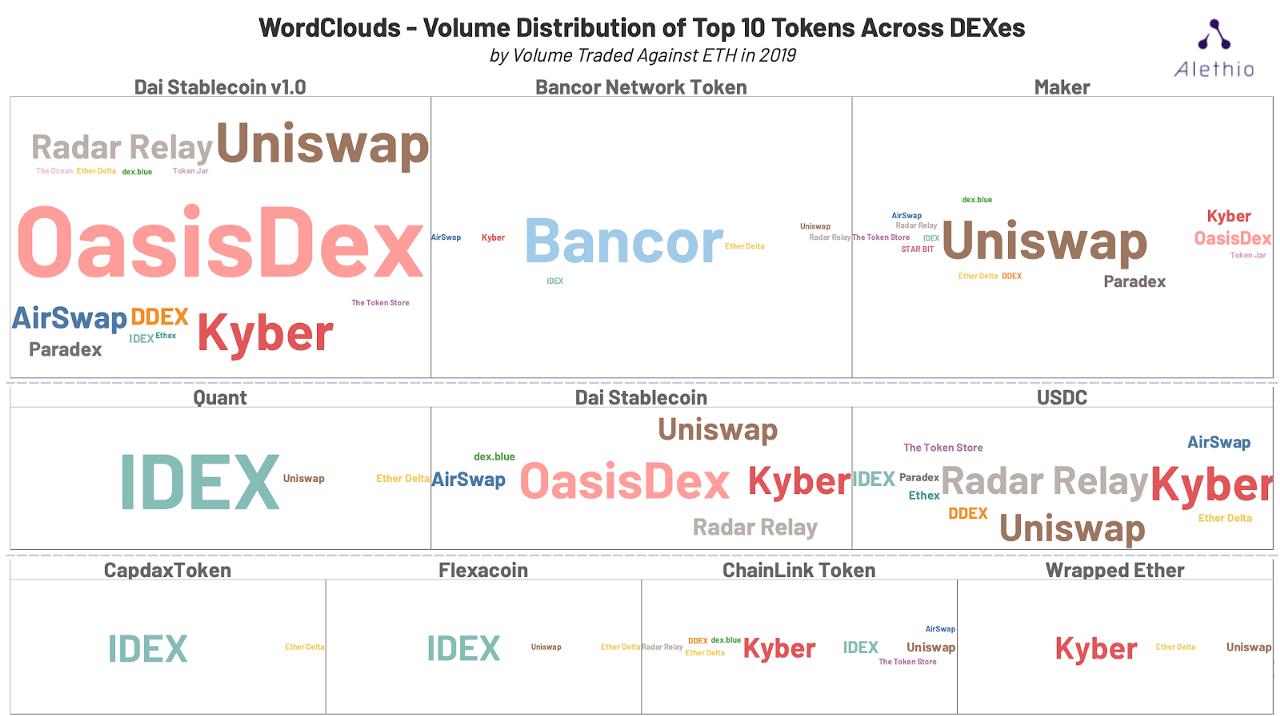

OasisDex, which is the market and trading platform derived from MakerDAO, contributed the most volume for SAI (~2.42million ETH). The SAI token was also circulated on Uniswap, Kyber, RadarRelay, AirSwap, DDEX, and Paradex, etc.
It is interesting to see their native token — Maker token has been traded more often on Uniswap than OasisDex.
BNT token (Bancor Network Token) has been mainly traded on Bancor, though also seen on others in much smaller numbers. Similarly, Quant, CapdaxToken, and Flexacoin are almost exclusive on IDEX, while ChainLink and Wrapped Ether for Kyber. On the contrary, for Dai Stablecoin (DAI) and USDC — the 2 major stablecoins, circulation distributions have been more evenly across all platforms.
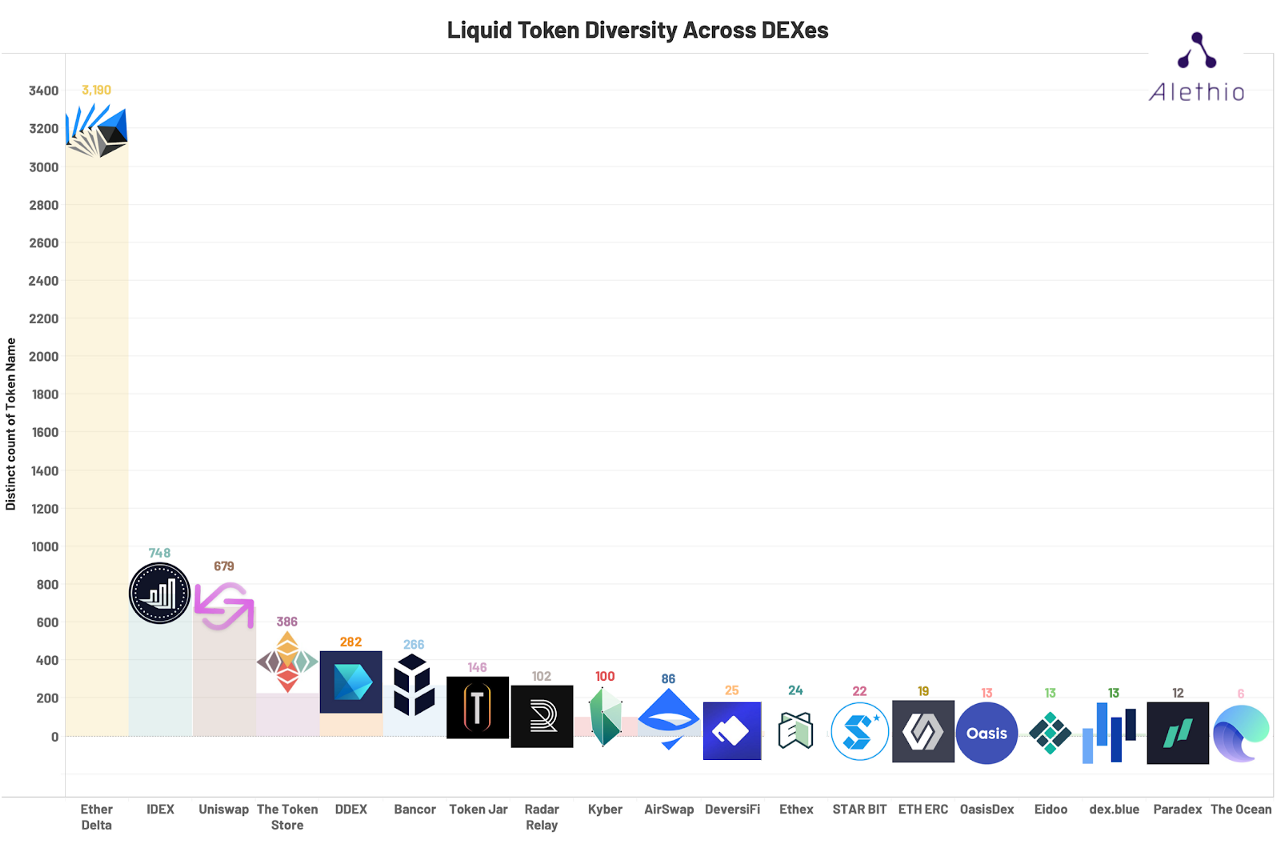
Liquid Token Diversity
Grouping by DEX, we can see the number of distinct tokens that have been liquid in 2019. Though EtherDelta was not in the top by trades (fig. 1) or volume (fig. 2), it still provides the most type of tokens for trading, with 3190 different tokens traded on it.
Note that “liquid token” is not the same as “available token” on DEXs. Some available tokens may not have market bids or asks, thus the number counted here may be smaller than the actually listed offerings.

User Base
Daily Active Unique Traders
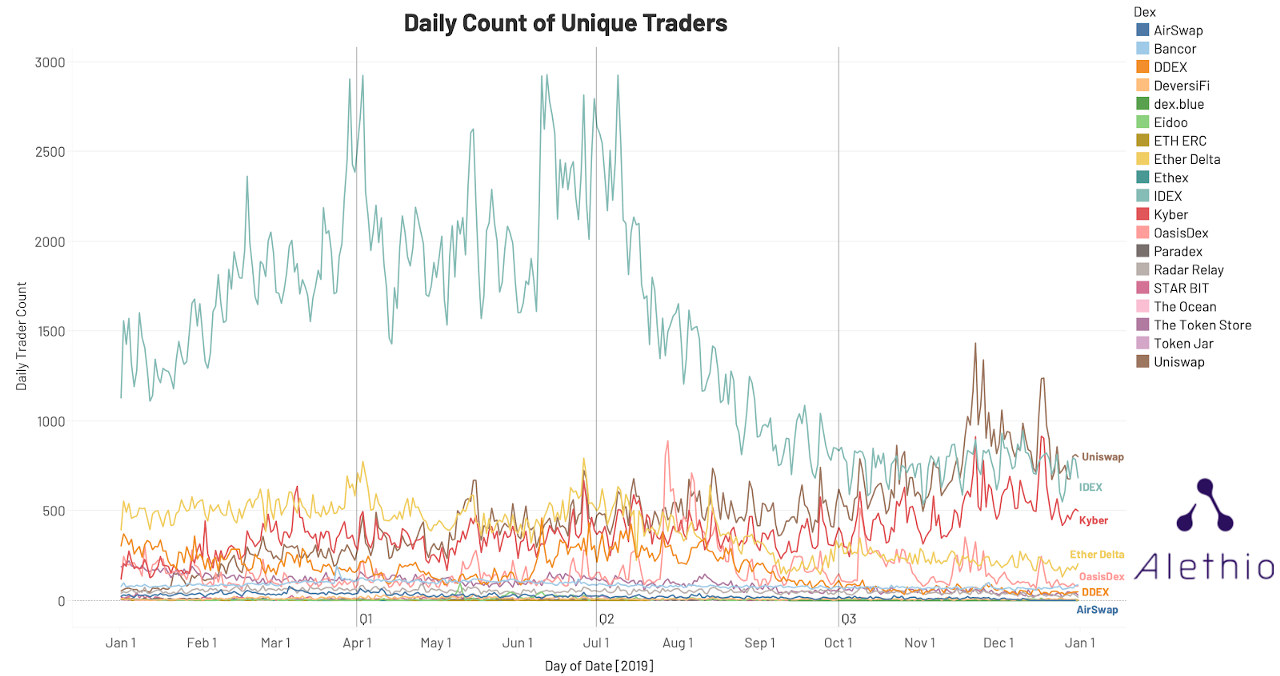

For IDEX, the daily count of unique traders follows a similar pattern of transaction count and volumes. Uniswap’s active user steadily grew over the whole year, and climbed up to ~1,300 active users per day at the peak in early December. OasisDex spiked up to ~900 users a day in late July, which is likely due to the CDP campaign of SAI rewards issuance.
A notable correlation here is between Kyber and Uniswap. The number of traders for these two platforms share remarkably similar values over time, which can possibly be a signal of them sharing a common group of users. The following network graph validates this assumption.
Network Graph: User Overlap between DEXs
By collecting unique addresses that served as makers or takers in trades, we are able to plot the user base network for DEXs, including the overlap of users between different DEXs.
For dex.blue, trader information is not logged with the trade execution, so we were unable to collect data for users. With these network graphs, it is important to note that the number of addresses here cannot be assumed to directly correlate to the number of users. One person may use multiple unique addresses, so the actual user size can be safely determined to be smaller than the number of addresses shown in figure X. However, it is the relationship between these protocols that is most telling.
Also, some protocols may show a “shrunken” size that is smaller than actual user size (e.g. Bancor). This is because, in their protocols, the logged trader address is actually the same set of forwarder or converter contracts that operate the actual trades.
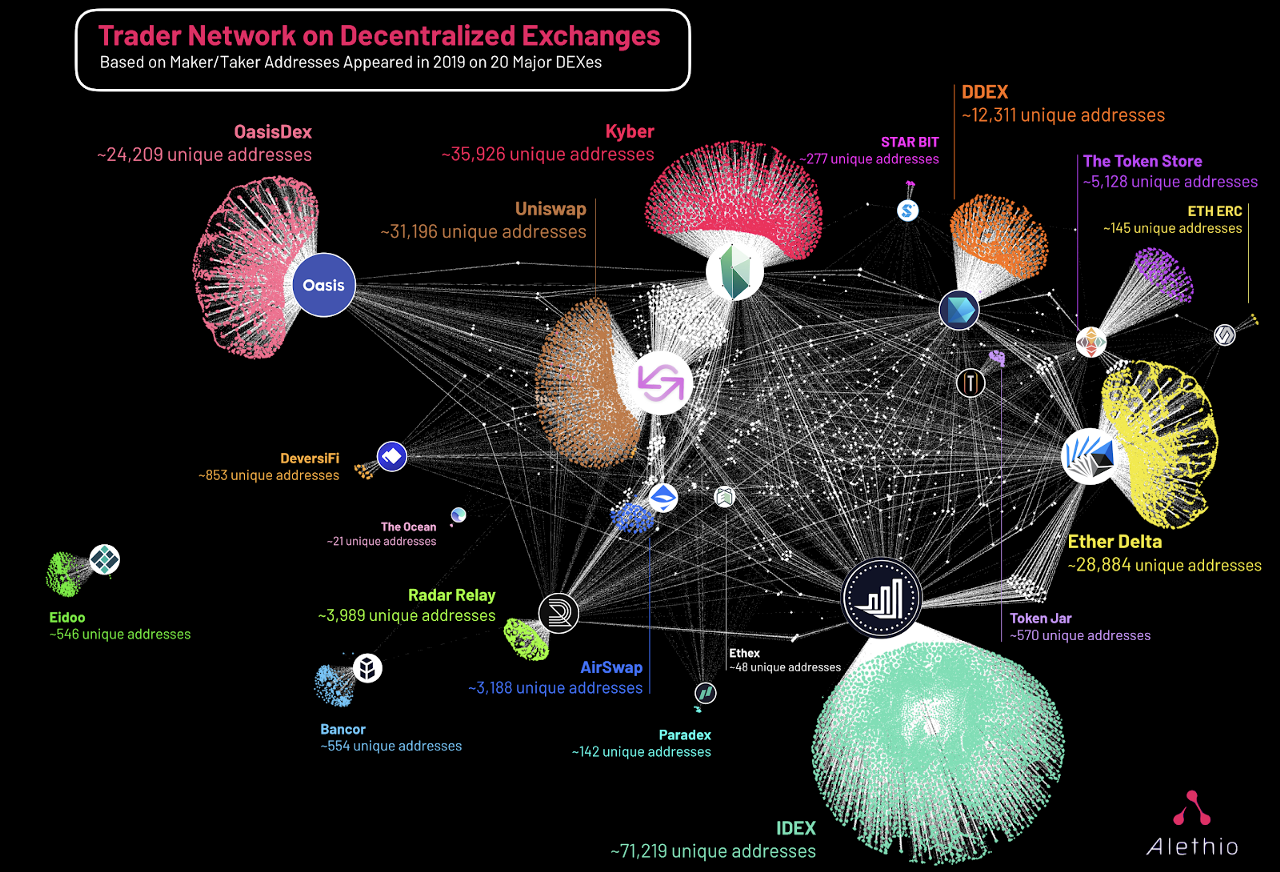

In the graph, colored dots (“exclusive traders”) are the addresses that only made trades on those individual platforms. White ones (“shared traders”) are shared dots across multiple DEXs. The total number of addresses found for each DEX is marked beside. Note that this number is not the size of the exclusive cluster but also includes the white shared nodes.
Notably, the largest shared group is between Uniswap and Kyber, which proves the assumption we raised earlier from the correlation in time series of their active users.
IDEX has the largest exclusive trader base, as indicated by the cluster size, followed by OasisDex and EtherDelta.
On the graph, Bancor and Eidoo seem to be isolated from the cloud, though it may result from the converter/forwarder system we mentioned earlier.
Disclaimer: Alethio has no preference or prejudice towards any of the projects mentioned above. The range of protocols discussed is limited and we will keep working on adding more in the list to achieve a more holistic view. Alethio has a strong commitment to staying neutral by providing facts and best judgments based on objective and/or verified information. This article should never be used as a guide for any malicious practice or trading suggestion.