
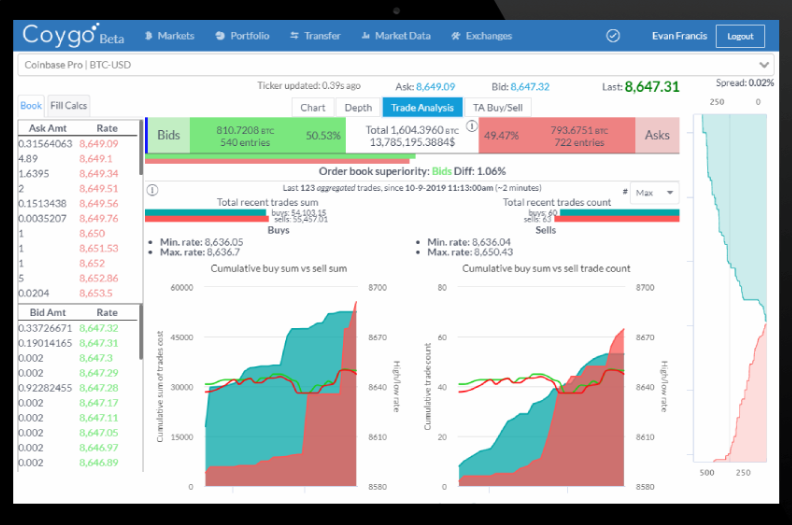
Coygo, a professional multi-exchange cryptocurrency trading terminal and portfolio tracking software, today announced a new tool called ‘Trade Analysis’ has been integrated within the Coygo platform.
This new feature enables users to view trades as they occur in real-time and analyze recent trade activity on any exchange or market that Coygo supports (Coinbase Pro, Kraken, Poloniex, Binance, and Bittrex).
Scan “Whale” Activity With Trade Analysis
One of the most useful features for the Trade Analysis tool is to spot if an increase in buy or sell volume is due to a whale making one large order, or a number of smaller trades.
One individual making a large trade can influence prices, but a large number of smaller trades trending in one direction may mean that there is growing positive or negative sentiment across a number of people, not just one individual.

The Trade Analysis tool displays two graphs. On the left “Cumulative buy sum vs. sell sum” charts the cumulative sum of buys and sells over time. A big increase for either area chart (buy or sell) means that there was a substantial increase in the volume of trades.
To the right is shown the “Cumulative buy vs. sell count” chart. A big increase for either area chart (buy or sell) means that there was a considerable increase in the number of trades.

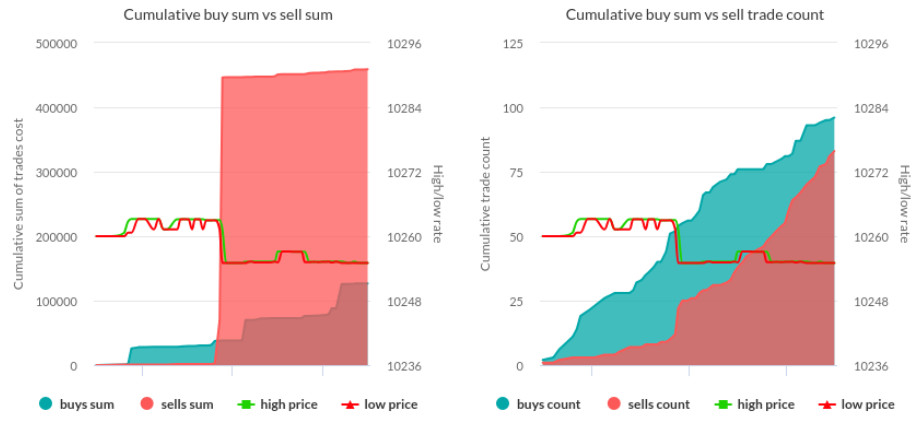
In the example shown above, the total selling volume (red chart on the left) increases dramatically over a short period of time (a few seconds), while the count of selling (red chart on the right) stays relatively the same with only a slight increase. This shows users that a large order was placed by one whale, or a small number of traders. For instance, possibly one whale made a large sell and a few trading bots saw that activity and decided to follow suit.