
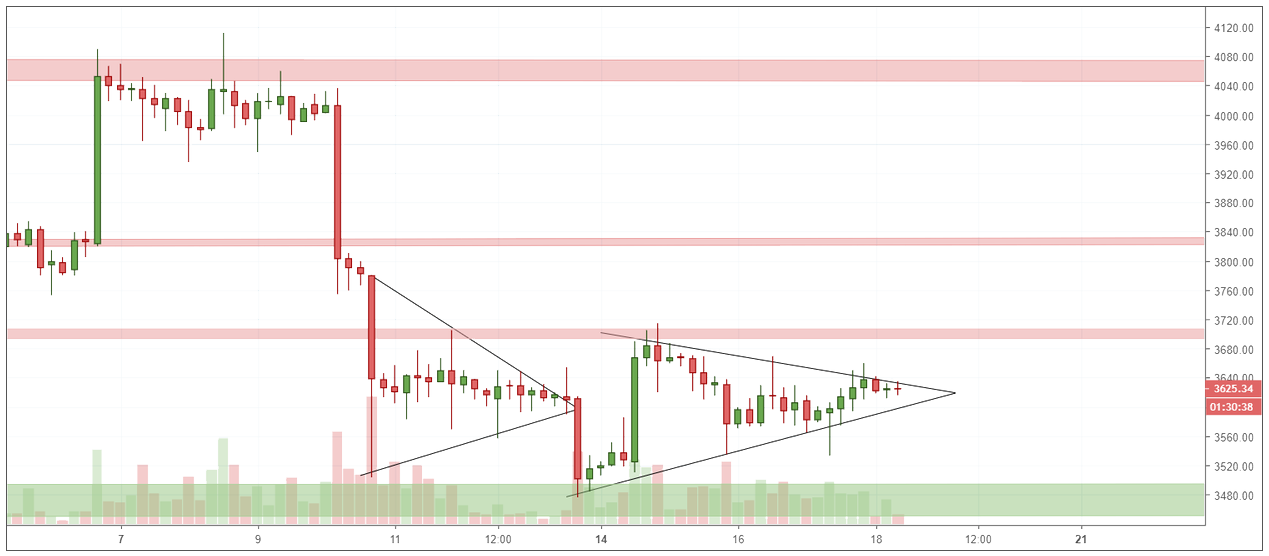
After a week of consolidation, bitcoin is currently trading at $3,620.
The price made several lower highs earlier in the week and has since coiled within a symmetrical triangle above the support level at $3,500.
Tightly bound by buyers and sellers on each side, bitcoin now finds itself poised for a breakout — either to the top of the range at $3,700, or the bottom of the range at $3,500. A breakthrough either of these levels is likely to yield a strong continuation in the same direction.
On the bearish side, the sideways action this week has been supported by little volume, showing lack of strength and interest in the market, and suggesting that a strong catalyst is needed for a push upwards. This is supported by the RSI which is currently sinking below the bull/bear line at 50.
Away from the charts, news has been bullish, with several over-the-counter trading firms —like Genesis and Cumberland — reporting record trading volumes from institutions purchasing large amounts of crypto.
As we inch closer to the apex of this symmetrical triangle, a conclusion could be expected soon.
If we move up, then immediate resistance lies at $3,700, $3,830, and $4,000 — a clean break of which would be very bullish.
Should we fall further, then support could be found around $3,500, $3,300, and then the low of $3,120.

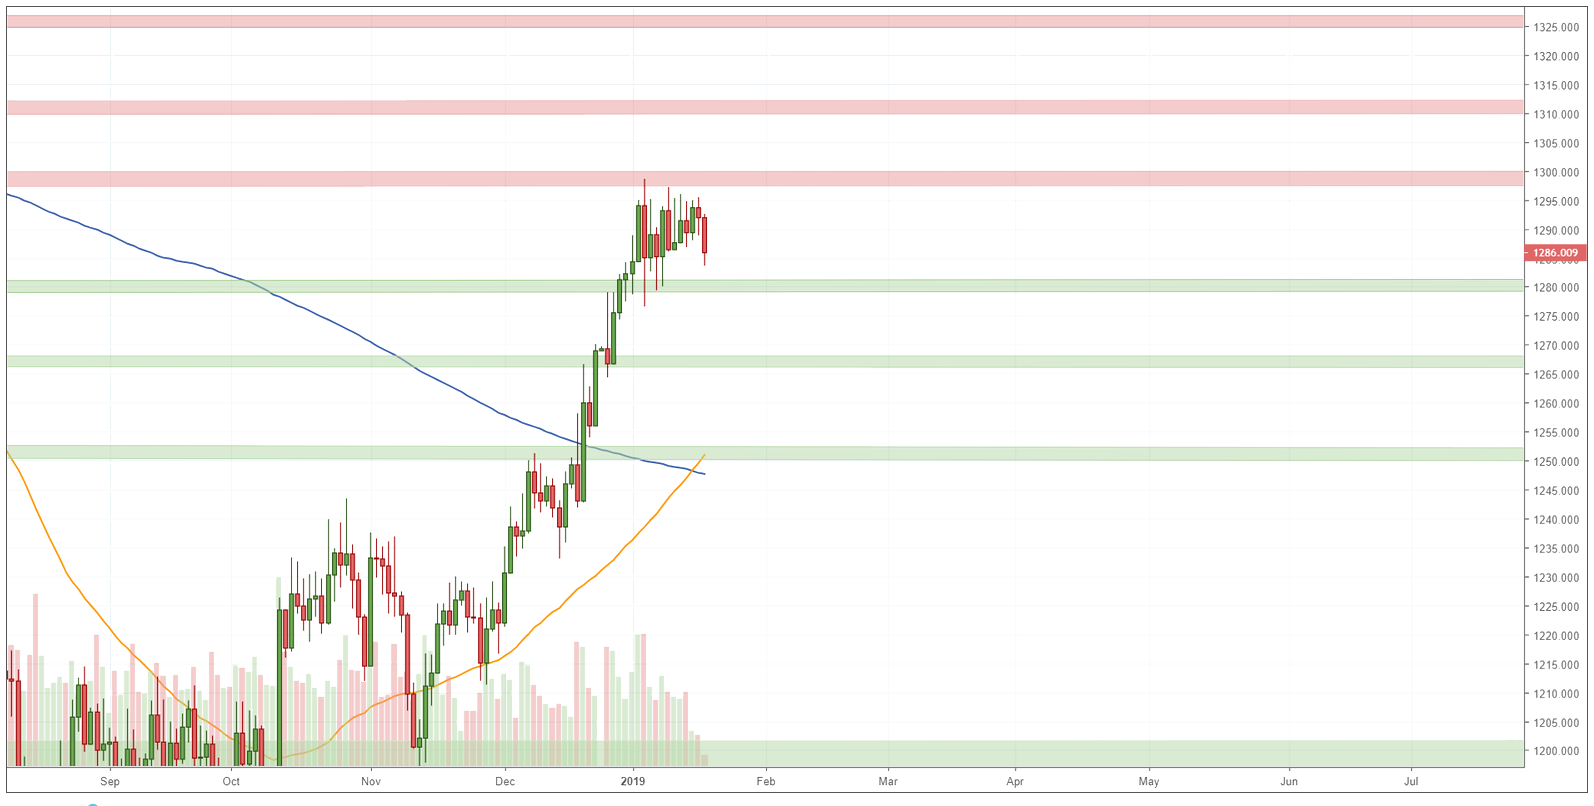
XAU/USD – Gold lingers under $1,300 level
At present, gold is trading at $1,288 after pulling back from the $1,295 level.
It has been an uneventful week for the yellow metal, which remains stuck in the same narrow channel, with buying and selling constrained against the $1,297 level that has now been in play since January 3rd.
Despite geopolitical turmoil in both the US and UK, with PM Theresa May surviving a no-confidence vote, and the US government shutdown dragging on, gold has lacked the catalyst to push up through $1,297-$1,300 level. Instead, the metal started to fall on Thursday on news that the US is considering easing tariffs on Chinese products, boosting investors risk appetite and triggering a rally in equities. Stronger than expected US jobless claims data also boosted the dollar, creating further headwinds for gold.
Looking ahead, a move through the $1,297 resistance line at the top of the bull flag will indicate buying pressure and is likely to lead a retest of $1,300 level. Beyond that, further resistance can be found at the June 2018 highs of $1,310. This bullish picture is reinforced by a golden cross which formed earlier in the week as the 50-day moving average (orange) crossed the 200-day moving average (blue).
If the present pullback continues, then strong support can be expected at around the $1,280 level, and then $1,268.

Disclaimer: This information is not financial advice, and should not be treated as a recommendation to buy or sell. It is to be used for educational purposes only.