
The analysis was published by bitcoin and gold exchange Vaultoro.
At the time of writing, bitcoin is trading at $6,248. With a daily volume of just under 4 billion USD.
Since the last update seven days ago, bitcoin has continued to slide, falling nearly 8% to approach the lows of June 25th.
In the last few hours, however, the price has steadied, after an unconvincing bounce that brought the price back up to face resistance at the $6,300 level, which previously acted as strong support.
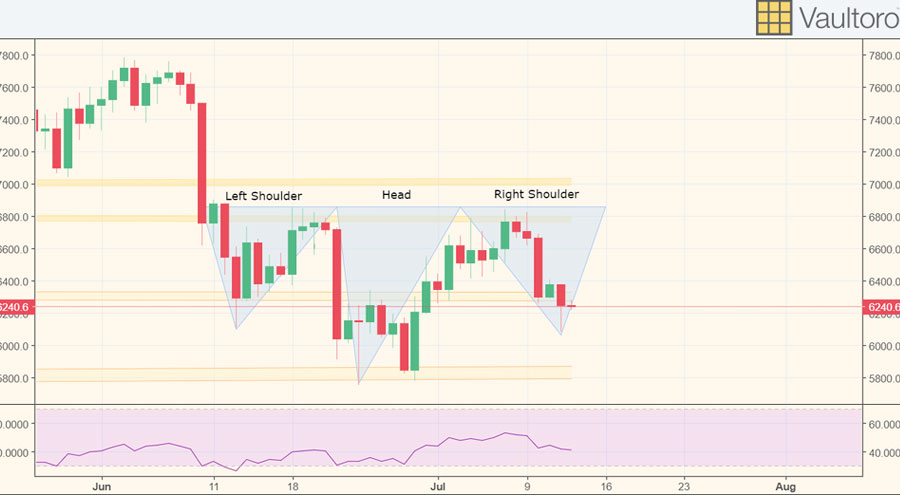
On the wilds of crypto Twitter, some traders have been suggesting that a bullish reversal might be playing out, prompted by the appearance of an inverse head and shoulders pattern on the daily chart.
This pattern consists of three successive troughs with a deeper middle trough (the head). The neckline of this pattern sits at $6,064, which if successfully broken will form confirmation of a price reversal, for the short-term at least.
A big move upwards, however, is unlikely, and market sentiment remains distinctly downtrodden, despite pervasive rumors that a bitcoin-backed ETF is finally coming closer to approval.
Should bitcoin swing even lower, then $6,000, and below that $5,800, are key levels of support to watch—this price region has formed a crucial foundation for bitcoin prices historically, and represents a 70% decline from Bitcoin’s high of $20,000 in December 2017.
Although many are suggesting this region could be the bottom, if further downside was to come in to play then lack of historic support below these levels could send bitcoin spinning down to below $5,000, letting traders know the true meaning of capitulation.
XAU/USD – Gold Builds Momentum on Weakening Dollar
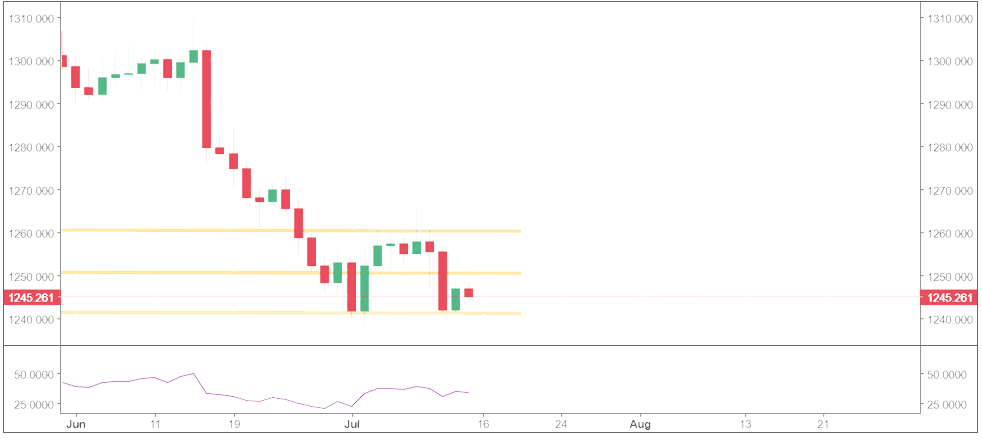
Gold has seen a slight rebound this week but fell back on Wednesday to meet support at $1,240 level. It has since steadied around the $1,245 region.
On Thursday, The U.S. Bureau of Labor Statistics announced that inflation in June fell short of expectations, rising to 0.1% instead of 0.2%. This saw Gold rise, as it also took advantage of a
weakening dollar—with the US Dollar Index now steadied at around 94.50.
But, as has been a consistent theme over the past few weeks, high-risk appetite has fuelled gains in major US equities, which hasn’t boded well for gold, making it difficult for the price to push much higher.
From a technical standpoint, over the past week Gold has formed a double bottom on the daily chart, a pattern that is widely considered to show a reversal. If this upward trend continues, then A breakout above $1,250 is likely to bring the $1,260 figure in to play.
If the bears retake control, then we might again see another 2018 low, pushing prices past the bottom at around $1238.

Disclaimer: This information is not a recommendation to buy or sell. It is to be used for educational purposes only.