
Bitcoin? Ethereum? Ripple? While these terms were limited to experts not long ago, last year saw an explosion of interest in cryptocurrencies, arguably driven by the astronomical rise in price.
In 2017 alone, the total value of all cryptocurrencies grew by over 3300% to over $600 billion, with bitcoin itself jumping more than 1300% over the course of 12 months.
Despite the spike in attention and valuation, it is unclear how many people actually own cryptocurrencies. This post is an attempt to measure the spread of awareness, knowledge, buying intention and ownership of cryptocurrency.
To do this, we used Dalia’s unique access to people across the globe to run a 24-hour rapid survey across over 29,000 internet-connected people in 8 of the largest cryptocurrency markets (US, UK, Germany, Brazil, Japan, South Korea, China, and India). To arrive at the most accurate estimate possible, we used an advanced statistical technique called MRP to increase representativeness.
This first post will briefly introduce the results gathered, while a second post later this month will explore the findings in more depth and discuss potential causes and implications.
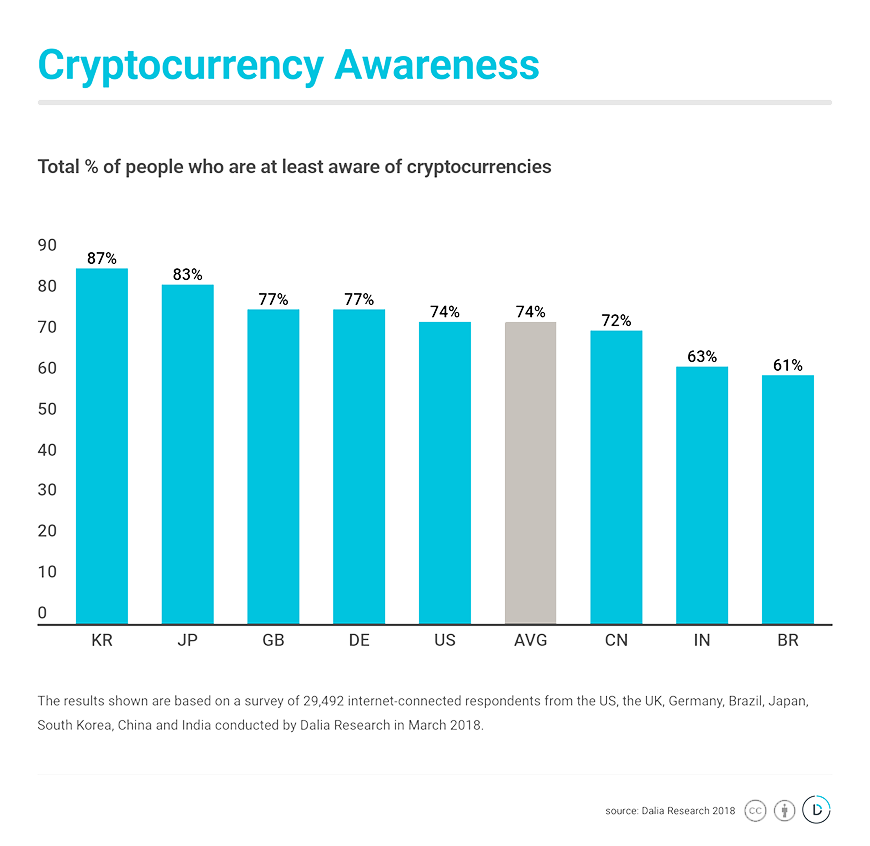
3 in 4 people have heard about cryptocurrencies
Almost three-quarters of all respondents say they are at least aware of cryptocurrencies. Considering that cryptocurrency was virtually unknown to the public only several years ago, this spread of international awareness is groundbreaking.

Half of the surveyed population knows what cryptocurrencies are
But is crypto just a buzzword? Or do respondents actually know what it means? As our results show, roughly two-thirds of respondents that have heard of cryptocurrency, also know what it is. Across all 8 countries, an average of 50% says they have knowledge of cryptocurrencies.
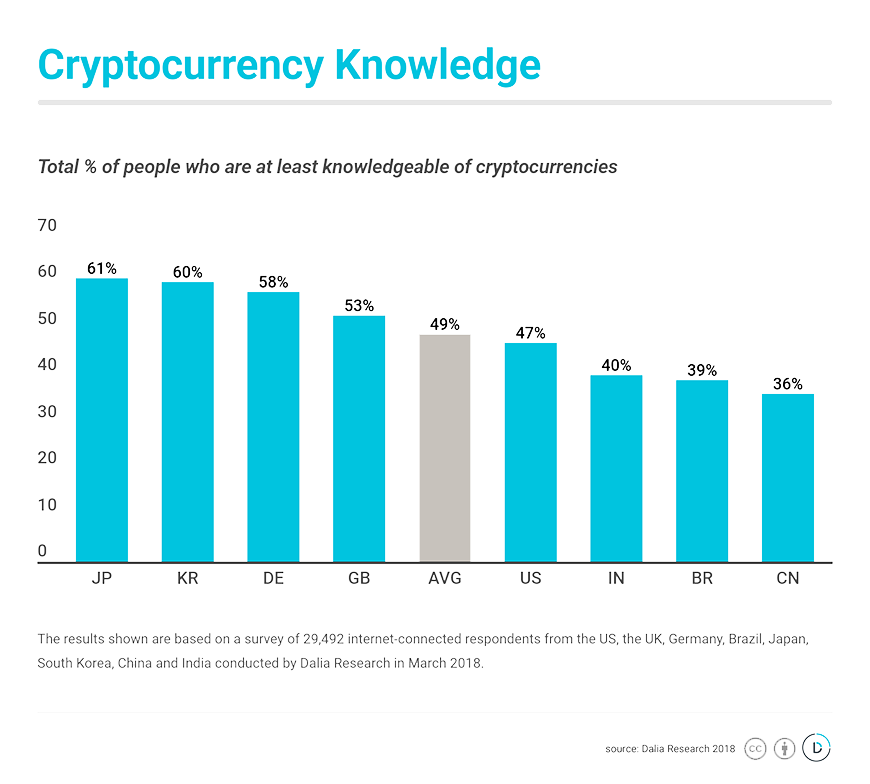

Unsurprisingly and in line with the previous paragraph, Japan, and South Korea are ahead in this comparison, where about 60% of the online population know what cryptocurrencies are. Both countries have experienced a lot of attention to cryptocurrencies, particularly when it comes to bitcoin with trading software. According to Inside Bitcoins, one of the most commonly used trading software is Bitcoin Trader. Interestingly though, these are also the countries with the lowest buying intention, as shown in the following.
4% of non-owners plan to buy cryptocurrencies
Numbers below are net and exclude cryptocurrency owners, i.e. this is only the buying intention of respondents who do not own cryptocurrencies yet.
After prices and media attention reached new highs in 2017, we wanted to find out whether people plan on investing more in cryptocurrencies. Our results show an average of 4% of respondents have the intention of buying cryptocurrency, with most of the countries ranging between 6% and 3%. Compared to the high levels of awareness, these numbers show that cryptocurrencies are still early in their adoption cycle.
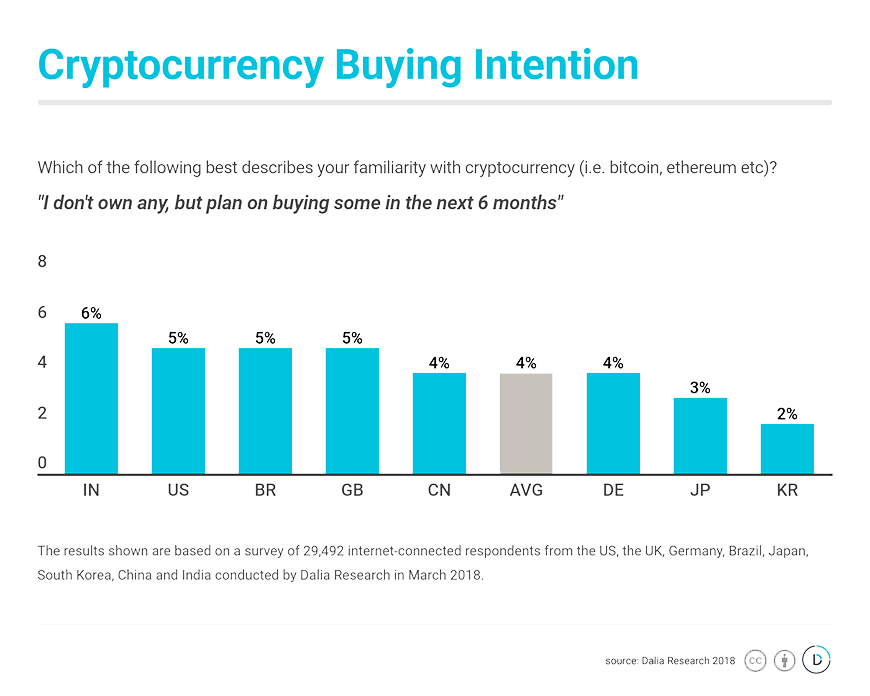

As mentioned, South Korea and Japan are interesting outliers as they rank highest in terms of awareness and knowledge, but have expressed low intention to buy cryptocurrencies in the next 6 months. For these countries, in particular, this could be a sign of slowing investments and less positive sentiment.
Japan has the highest cryptocurrency ownership
Our main goal was to find out cryptocurrencies’ ownership rate. And what we found is that of the 29,000+ internet-connected respondents across all countries, about 7% say they own some cryptocurrency. This shows that cryptocurrencies are not only a media phenomenon but actually owned by a notable chunk of the population. It is interesting to see that ownership is higher than buying intention among non-owners and could be a sign that a majority of the early adopters are already on board.
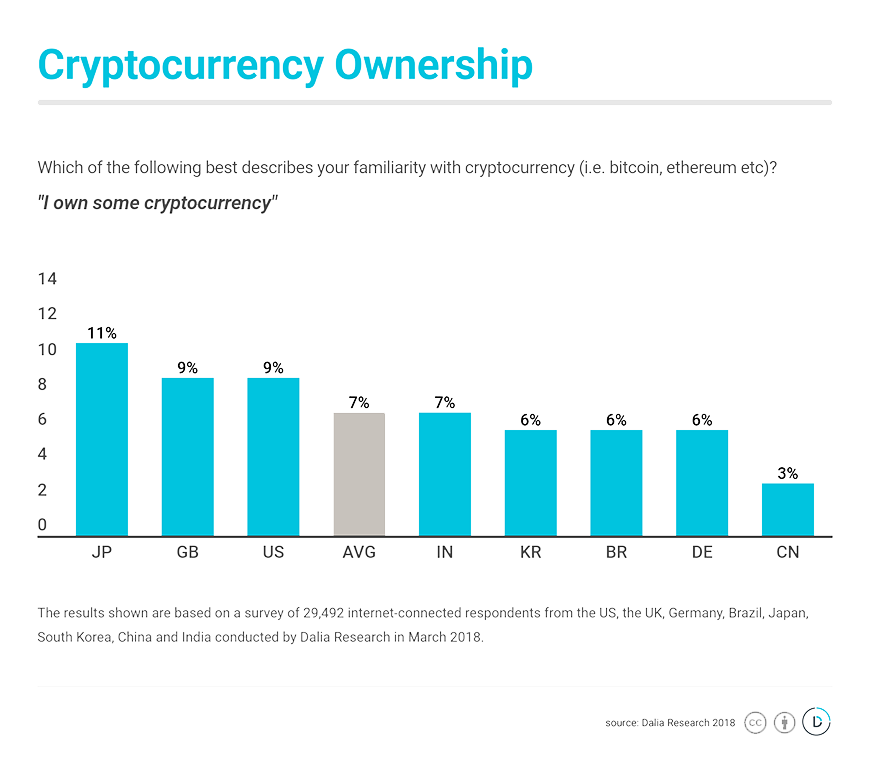

Unsurprisingly, Japan has the highest degree of adoption and is the only country to score in the double digits for ownership, at 11%. This is in line with the general consensus in the cryptocurrency space, where Japan is believed to be leading the world.
Second and third are the UK and the US, both with around 9% ownership. With the exception of China, which has a cryptocurrency ownership rate of about 3%, all other countries surveyed hover around 5–6%.
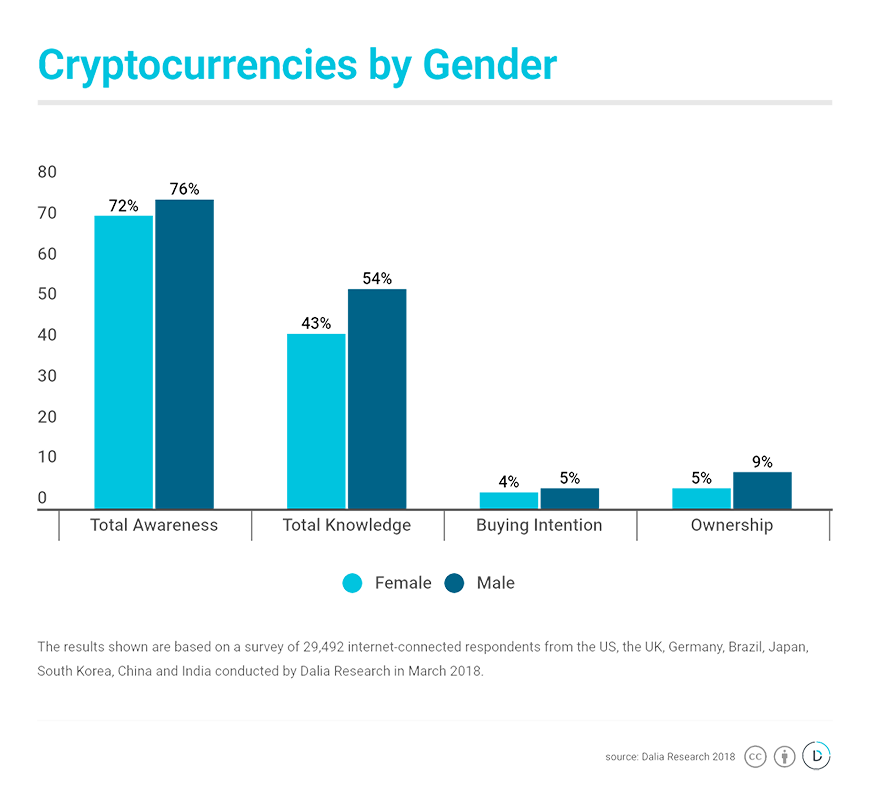
Cryptocurrencies by Gender & Education
For anyone who has dealt with the cryptocurrency/blockchain community, it should not come as a surprise that men rank higher across all categories outlined above. Among the metrics we measured, we found the highest gender gap was within the knowledge of cryptocurrencies, with a gap of 11% on average.
There are, however, greater gender disparities in Western countries than Eastern countries. When it comes to knowledge of cryptocurrency, for example, Western countries (US, UK, DE) have a gender gap of 19% while all Asian countries are in the single digits. Additionally, there is a little gender gap in China and India in cryptocurrency ownership (4%), whereas it is quite high in the US (13%).

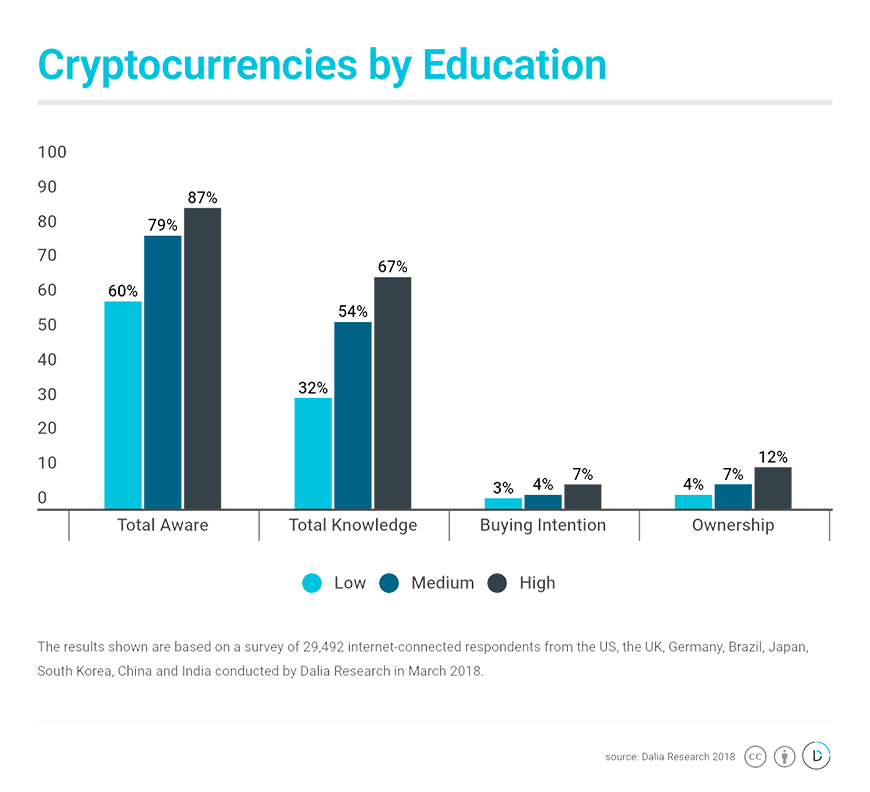
Respondents with a higher level of education are also associated with higher levels of cryptocurrency ownership (12% high education vs 4% low education), with similarly large differences for buying intention and overall knowledge (67% high vs. 33% low) of cryptocurrencies.
These results shed some light on the adoption of cryptocurrencies in the leading markets. So what can we take away from this? On the one hand, adoption is still in the early stages, but on the other, three-quarters of the surveyed population are at least aware of cryptocurrency.
About the Survey
The results shown in this post are from a survey conducted by Dalia Research in March 2018 to measure cryptocurrency incidence across the internet-connected population in the US, the UK, Germany, Brazil, Japan, South Korea, China, and India. The total sample size is n=29,492. In order to obtain census representative results, a Multilevel Regression Poststratification (MRP) model was built. The algorithm used to make cell-wise predictions was Logistic Regression and the cell structure was generated using data from Barro Lee/UNStat and Statista. The cell variables were age, gender, level of education (as defined by ISCED (2011) levels 0–2, 3–4, and 5–8) and mobile gaming frequency.